BAM & DAM ROI Calculator

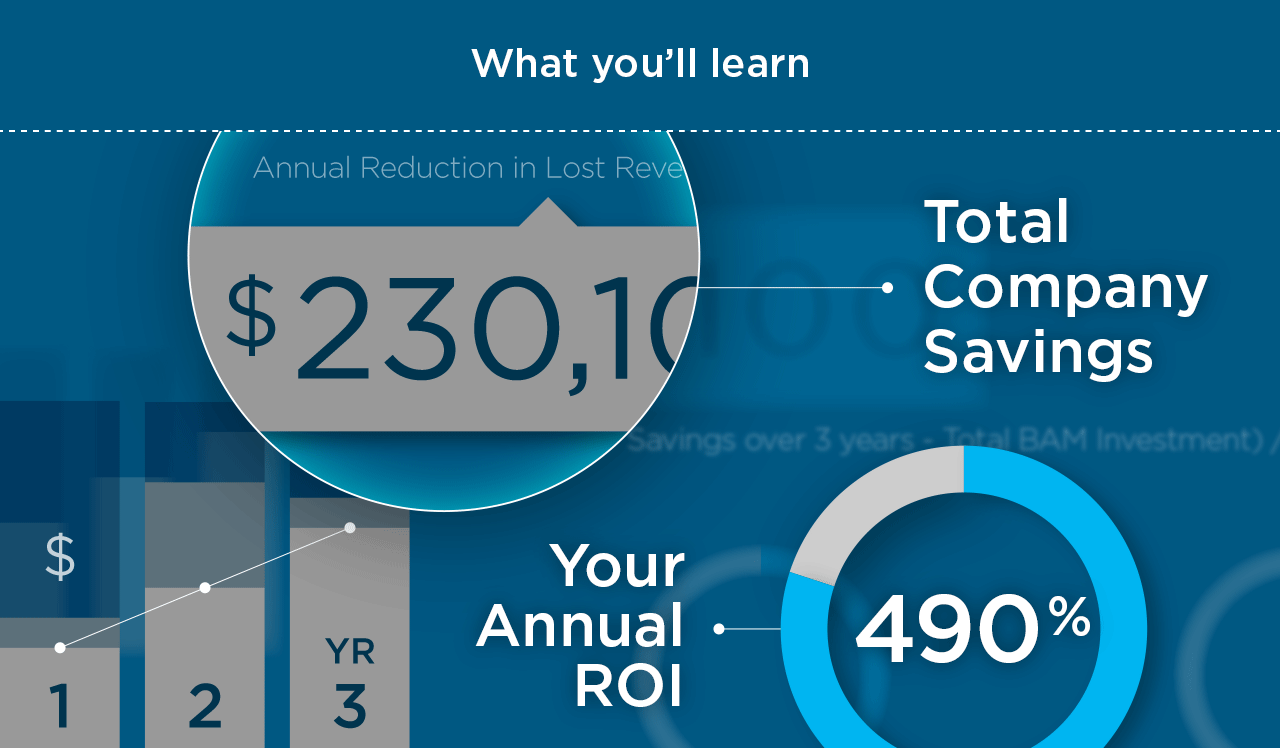
Find out how much a digital asset management solution could save your business.

DAM is the proven solution for today’s enterprises to effectively capture, manage, share and track branded assets. Significant cost savings are only the beginning.

Building a business case and calculating the return for any new system can be difficult, as the arbitrary way in which your employees currently manage and use assets can seem immeasurable across all use cases.

Despite these challenges, the ROI calculator is still a valuable benchmark to start with, as it outlines a calculation method and will help you identify the numbers that should be collected.

ROI Calculator

And more... Just answer 10 simple questions!

Get started

Identify the hourly rates of your DAM users

These are the people that will benefit from utilising the solution, ie. employees, other business units, creatives, marketers and external suppliers and contractors.

Remember to calculate other additional costs like insurance, capital expenses, payroll tax, and training benefits. Normally it is double the hourly rate.

info
Individuals interacting with assets in a DAM.
info
Is the average base salary for this team.
info
Number of annual leave weeks per year.
info
Based on 8 hours/day x 5 days/week x 52 weeks/year.
info
Based on (Hours Worked) - (Annual Leave).
info
Based on (Average Base Salary) / (Real Hours Worked).
info
Includes additional costs like benefits, training and other overheads (see below).
info
Based on % of (Average Base Salary).
info
Based on (Average Base Salary) + (Salary Extras).
info
Loaded hourly rate for each member of your team. Based on (Loaded Salary) / (Real Hours Worked).
Show calculations

Place a value on your digital assets

Identify how much you’ve paid for your assets, whether it’s commissioned artwork, contracted design work, licence fees for stock images, the cost of photo shoots etc. You’ll be surprised at how how your asset collection is worth!

Losing assets and having to replace or re-create them due to ineffective search tools, inadequate metadata or filing systems is an expensive and unnecessary cost.

info
Number of assets the business has in total (includes images and all other documents).
info
The total value of assets (this is a conservative estimate). Eg. You’ve invested $80,000 in licensed stock images and $220,000 in commissioned artwork, photography, video and designs. Keep in mind that your final designed assets are worth significantly more, so you don’t want to lose them or make them difficult to locate and reuse.
info
Assumed cost to the company to recreate each asset.
info
Assets lost annually based on each person losing 1 asset a year. To lose one of these assets could cost the company relicensing fees, additional photo shoot expenses and redesigning efforts. These assets have a high replacement cost if lost.
info
Having a DAM in place would dramatically reduce this risk.
Show calculations

Work out the time spent searching for digital assets

When users can’t find what they’re looking for, there is a huge operational cost to your business.

According to recent findings, users spend an average of 3 hours per week searching for files. Based on our analytics, users can reduce the time spent searching for files by up to 80%.

info
In our experience, DAM software can reduce the time spent finding and accessing files by 80%.
info
This is assuming your digital assets are properly tagged and organised. Remember, this calculation doesn’t even address all the intangible values of DAM like brand management, time saved by reusing files, business insights from analytics and other benefits.
Show calculations

Work out the costs of distributing digital assets

Depending on the average file size, physically sending out digital assets to agencies or partners incurs both your time and courier costs.

When calculating the Average Courier Cost, remember to factor in that distribution costs can include physical media, labelling, admin, burning to disk, boxing up and ultimately shipping. Given this, a typical figure per package is $100-$125.

info
Based on assets previously entered for the business.
info
Percentage of total assets that are manually couriered.
info
Per parcel dispatch.
info
Total Distribution Costs if done manually.
Show calculations

Almost there!

Now, add the cost of your DAM implementation.

Implementation and ROI

Now, let’s assume the purchase and deployment of a DAM implementation is $25,000, and the annual support and license investment is $12,000.

info
Up front software investment.
info
Annual recurring investment.
info
Total distribution costs.
info
BAM investment (upfront + first year investment).
info
Net Savings in first year alone.
info
Annual recurring investment X Years.
info
Invested over X Years.

Thank you.

Please view your final ROI results and Total Company Savings below. All calculations are now available for view. If the calculations seem unrealistic, feel free to scale back with more conservative numbers.

Show calculations

10 December 2015

Free
demo